
不論是個人專案或是工作項目,當我們完成功能、想要進一步優化系統效能,我們首先要做的事情,便是知道目前系統的表現狀況為何。表現狀況通常可以簡單分成基本與進階,基本的像是 query 頁面的時間、功能是否都健康,而進階的比如說像是當系統遇到 high traffic 時每個 service表現的狀況、系統會在哪邊出現 bottleneck etc。而一旦知道目前系統的表現,我們也可以開始進一步思考有哪一些部分可以再做得更好,比如說讓查詢效率提升、錯誤率下降etc,可以透過微調哪一些元件來達成我們的目標。
有很多衡量系統效能的工具,比如 Kibana, Datadog, 以及我們今天要介紹的工具:Prometheus + Grafana。
Why using Prometheus & Grafana
一句話來說的話:免費、開源、社群支持度強。
Prometheus 最早於 2012 年由 SoundCloud 開發並開源,主要用來收集、儲存與系統有關的數據,以便監控其效能。許多的 Prometheus components 皆以 Go 撰寫,便於 static binaries 的建構以及部署。他主要有六個特點:
- multi-dimensional time-series data model: Prometheus 使用一個多維度的時間序列數據模型。每個時間序列由指標名稱和一組 labels 作為唯一標識,這使得在進行查詢和分析時,可以非常靈活地做資料過濾和聚合。
- 多種數據取得方法:Prometheus 除了可以從 server的 metrics endpoint 自 HTTP 收集數據之外,還支援 Node Exporter, Blackboc Exporter等方法。另外,Prometheus 有一個名為 Pushgateway的元件,可以透過 HTTP 去 cache 收集到的數據,然後定期的讓 Prometheus從中取得資料進行監控與存儲。
- PromQL(Prometheus Query Language): 一種自定義的查詢語言,提供豐富的功能,可以執行各種數據分析與操作,像是 data selection或 aggregation。
- 警報機制:透過設定閥值,當條件被觸發,Prometheus內建的 AlertManager 就會透過比如 email, slack 等發送通知。
- 簡單可視化metrics的 web ui: Prometheus 提供一個簡單的 web ui, 可以可視化 PromQL expressions, 並透過 table或是 graph做數據呈現。
- 活躍的開源社群:社群會維護許多第三方 exporters, integrators, 以利於 metrics 的收集。
Prometheus architecture diagram.
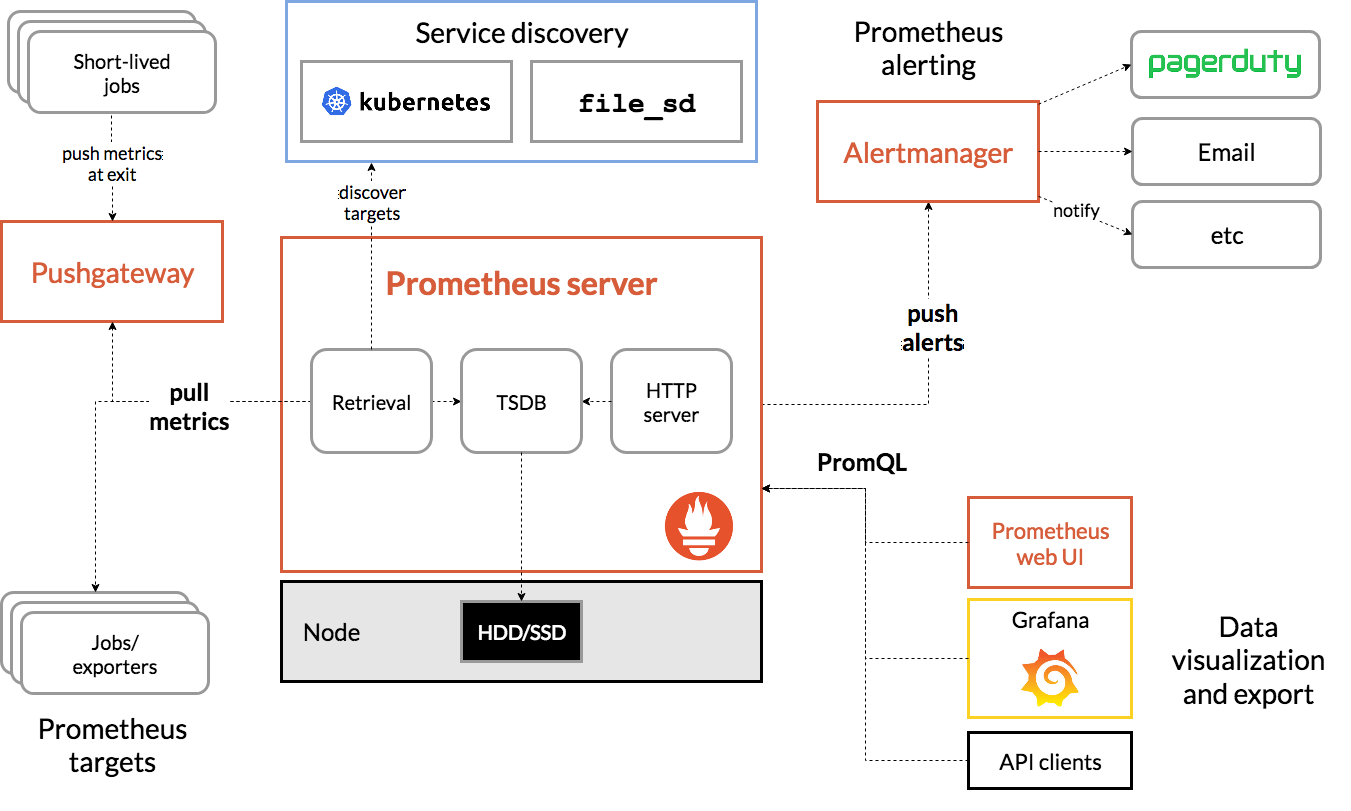 Credit: Prometheus.io
Grafana 最早則於 2014 年由瑞典公司 Grafana Labs 開發與開源。Grafana 會從多種數據來源(datasources)取得資料,並提供豐富的圖表、面板、儀表板,讓這些被處理後的數據可以展示於上。數據來源可以有很多種,而 Prometheus是其中一種常見的來源。原因大概是因為 Prometheus量測的指標比如 cpu, memory, heap, event loop 都是 time series data, 而 Grafana 儀表板中的 panels 在接收格式與呈現方式上很適合這種資料;Grafana query area支援 PromQL,所以會 PromQL 的話也可以輕鬆在 query area製作 Grafana圖表。以下是 Grafana的幾個特點:
- 支援多種數據來源:除了 Prometheus之外,也支援時間序列型資料庫(如 Prometheus、InfluxDB、Graphite)、日誌數據(如 Elasticsearch、Loki)、關聯式資料庫(如 MySQL、PostgreSQL)等。
- 豐富的圖表、面版:包含折線圖、柱狀圖、餅狀圖、地圖、表格等,並支援多種自定義的配置,以滿足不同的可視化需求。
- 豐富的查詢語言:除了 PromQL 之外,也提供像是 InfluxQL等查詢語言。另外,Grafana 也有智能提示、syntax highlighting 等功能。
- 警報機制:Grafana 內建警報功能,可以根據數據設定相關閥值,一旦條件被觸發,即可發送警報通知。Grafana 支援多種通知方式,比如 email、Slack、PagerDuty 等。
- 活躍的開源社群:一樣,社群會維護許多第三方plugins, 便於 Grafana平台不斷的擴展。
File structure & docker-compose
以下先用 top-down 方式簡單呈現一個 Node.js 專案中如何放入 Prometheus 與 Grafana 相關的檔案,之後再說明各個部分的細節。
folder structure:
|
|
在 local 分別起 server, prometheus, grafana 三個主要的 containers.
docker-compose.yml:
|
|
Prometheus configuration
1. prometheus.yml
|
|
Prometheus 會根據你設定的 scrape_interval 以固定的時間間隔擷取資料。scrape_configs 用於設定不同 job 的任務目標,此處意指從 target 的 [address:port number] 處擷取資料。
值得注意的是:targets 的bracket中,由於我們使用docker,且運行於 mac上,所以冒號前者的 value 會是 docker.for.mac.localhost。我在一開始把位置誤寫成 server container name, 導致 prometheus 遲遲無法取得送到 localhost:4000的資料。
2. prom-client
接著便要開始利用 Prometheus 自 APP server 擷取資料。我們需要將 APP server與 許多metrics exporter 連接,並透過這些 exporters 傳送資料至 Prometheus server 讓其存儲與監控 APP 的表現資料。
Express APP 會透過 prom-client 這個 nodejs library 將 metrics export出去。安裝方法:
|
|
完成後,在 index.js 我們可以開始使用 prom-client 去協助我們取得 APP 中的各種數據。在 Prometheus 中開發者重視的數據基本上可以分成三種:
- defaultMetrics: Prometheus 官方推薦了一系列值得觀測的指標,在 prom-client中,這些指標被匯總成為「defaultMetrics」。例子: node_process_cpu_system_seconds, nodejs_eventloop_lag_max_seconds, node_process_heap_bytes 等。這些指標會自帶像是 nodejs, node 等 prefix。
- http_request_duration_seconds: 這其實是一個主要功能是計時器的 histogramtimer 指標而已,然後我們把它命名為 http_request_duration_seconds。具體來說,時間對於 routing 來說是最基本的表現指標,因此,這個 metric 最主要的目的是協助我們知道每一個 route 的 http request time performances,透過設定這個指標加上撰寫相關的 PromQL,我們可以知道每一個 route的 response time等。
- custom metrics: Prometheus 提供開發者自定義四大類 custom metrics: Histogram, Summary, Counter, Gauge. 簡單說明一下每一個指標的定義與用途:
- Histogram: 直方圖,用於監控某個指標的分布狀況。Eg: Request time的時間分佈。
- Summary: 摘要,用於監控某個指標的分布狀況,特別是其詳細的統計分佈區間,比如 max, min, ?% quantile。Eg: Request time的時間分佈摘要。
- Counter: 計數器,用於監控一個 service 或者 event 的發生次數。Eg: 某 request 的 發生次數。
- Gauge: 計量器,用於監控一個隨時間而變化的數值。Eg: Memory usage。
這邊我們主要針對 defaultMetrics 與 http_request_duration_seconds 去監控。
|
|
「Registry」是 Prometheus 數據存處所在之處,我們會 init 一個 registry instance,然後將收集到的 defaultMetrics 數據傳入 registry 中。collectDefaultMetrics() 提供其他客製化的選項,像是 prefix 可以在每個 default metrics前面加上前綴、timeout 可以客製化 timeout 時長、gcDurationBuckets 則是設定 Garbage Collection Histogram(垃圾回收行為監控)的 bucket 寬度。最後再將 register instance 也放入 options 中完成註冊。
3. prom-middleware
|
|
當 defaultMetrics 已經註冊於 register,我們需要將另一個重要指標 http_request_duration_seconds 也放到 register 中。這邊我使用的方法是簡單寫一個 middleware,讓每一個 route 都可以被其經過,並被紀錄 request 打入後 response time 與 response status code。
middleware 如下:
|
|
從這兩段程式碼我們可以發現,基本上我們做的事情如下:
- (1) 創建一個 middleware,其中 new 一個 histogram,把它命名為 http_request_duration_seconds,並將其註冊於 register。
- (2) 在我們的 main app 中,使用 app.use() 讓之後出現的 routes 都可以經過它。值得注意的是,如果你的 express app 有使用 session,必須確保 Prometheus configuration 發生於 session 使用之前、routes註冊之前。
- (3) 當 route 被打時,計時器被啟動,將數據記錄於 histogram,當 route結束時,紀錄 method, route, code。
|
|
最後,創建一個 /metrics endpoint,當 app 被使用,app會將register收集到的 metrics() 返還。由於 metrics() 會返回一個 Promise, 所以必須使用 async-await 來取得數據結果。
Grafana configuration
1. datasources.yml
如同前面介紹所說,grafana 從 datasources取得數據呈現於儀表板上,所以這個 yaml 主要用於 configure datasource 來源。以下為 yaml檔內容:
|
|
configure後,grafana container 會自動註冊 http://prometheus:9090 於 Settings, 不需額外登入 grafana 手動註冊。
2. dashboards
dashboards 為定義 grafana 儀表板的內容,基本上你可以在 grafana container 起起來之後手動拉儀表板,也可以使用 predefined dashboards,使 container 起起來之後快速的看到儀表板。
這邊借用 Stack Abuse 網站創建的超完整儀表板。基本上他建立了四種不同的儀表板,當 Prometheus 數據進來之後,可以依此監控各種目標。四個儀表板分別是:
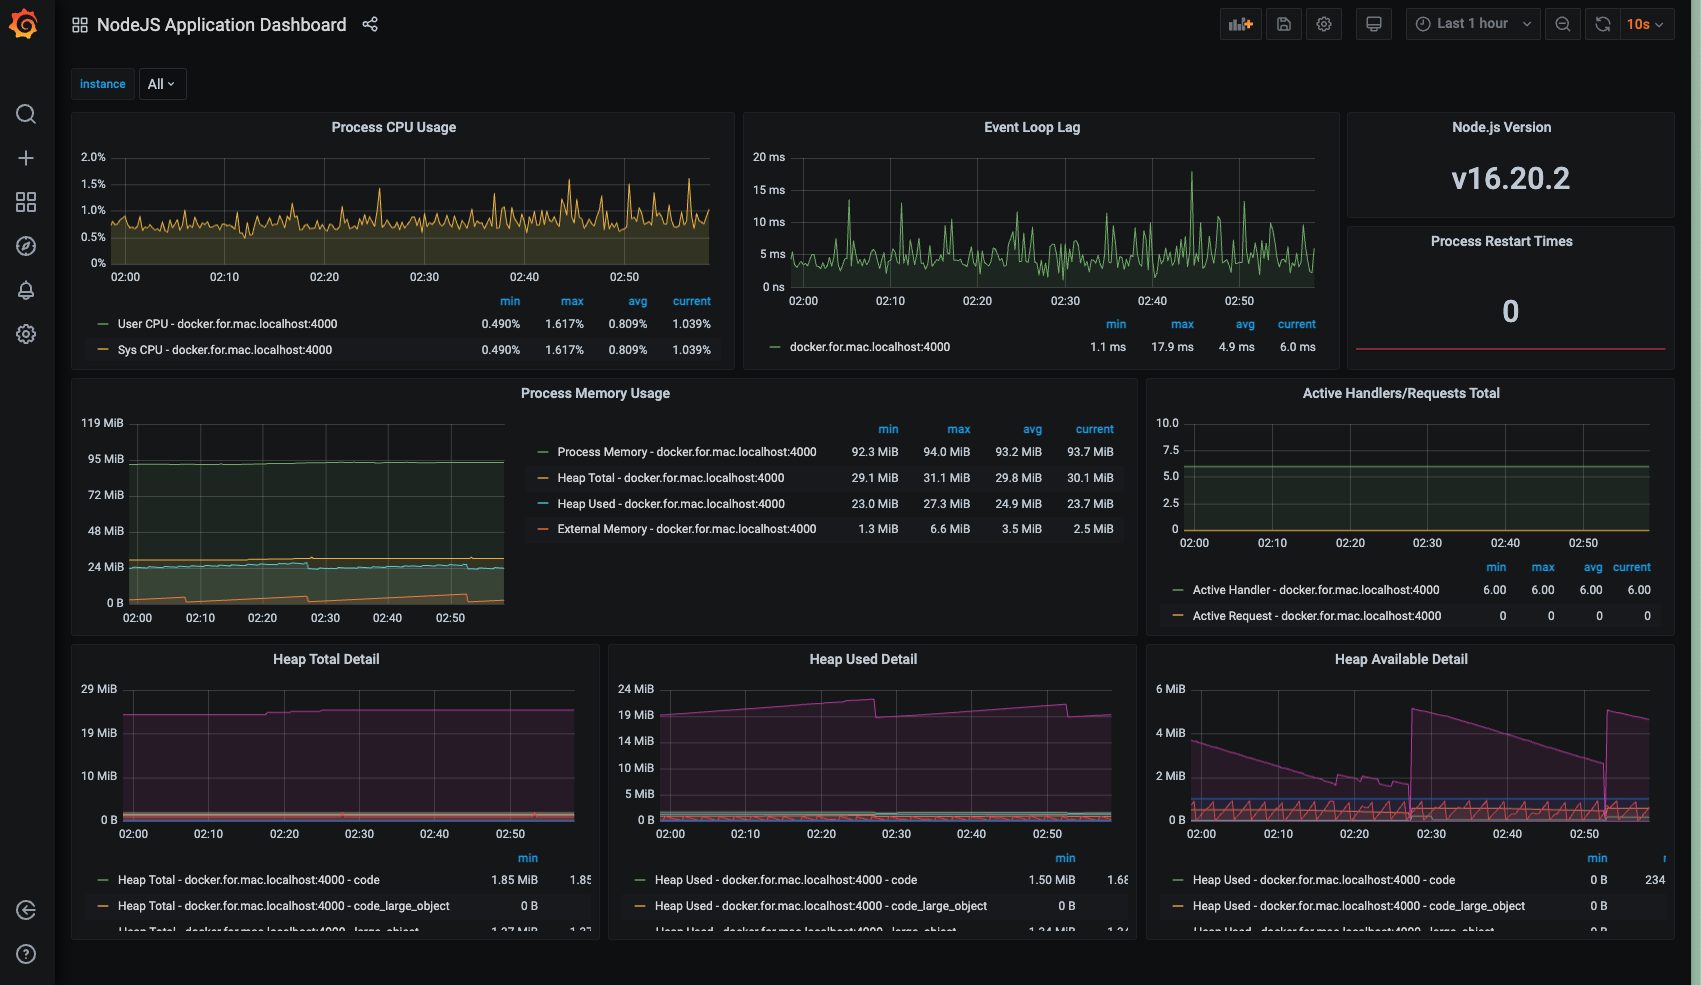
- Node Application Dashboard: 監控如 Process CPU Usage, Process Memory Usage等基本 metrics.
- Node Service Level Metrics Dashboard: 以 route/service 為單位,監控每隻 route的 Number of request, error rate, request處理時間等。
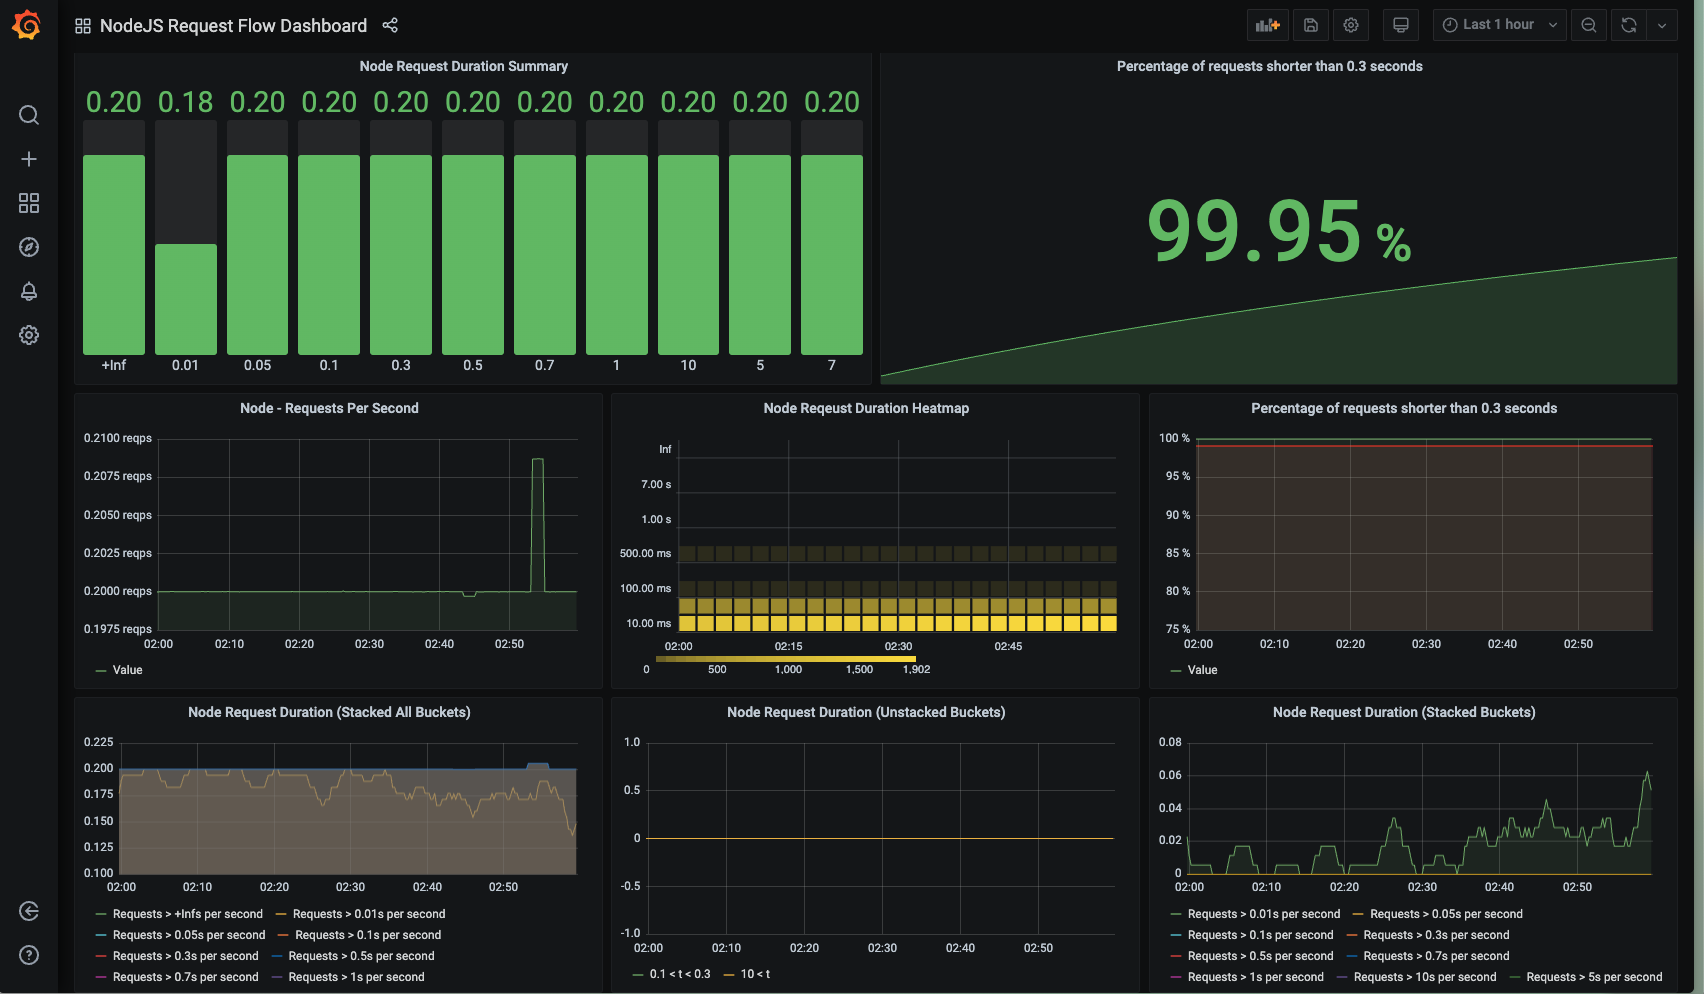
- Node Request Flow Dashboard: 以 request 為基礎,監控 request的各種面向,如時長 (duration),並用各種圖表可視化。
- High Level Application Metrics: 監控整體app的 throughput, response time等。
另外,dashboard 也需要有 yaml 做 configuration. 如下:
|
|
Showcase Each Part
當我們成功 configure Prometheus, Grafana,我們便可以看到以下幾個畫面:
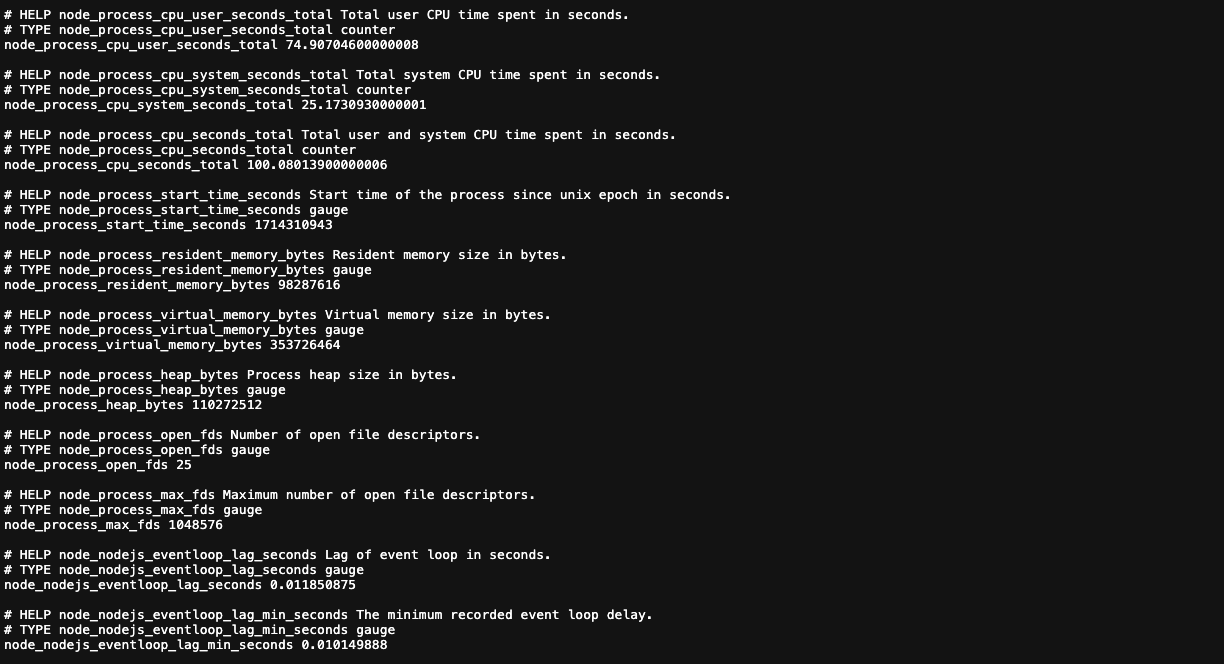
1. on localhost:{port}/metrics
main app metrics endpoint 可以看到許多筆監控數據。
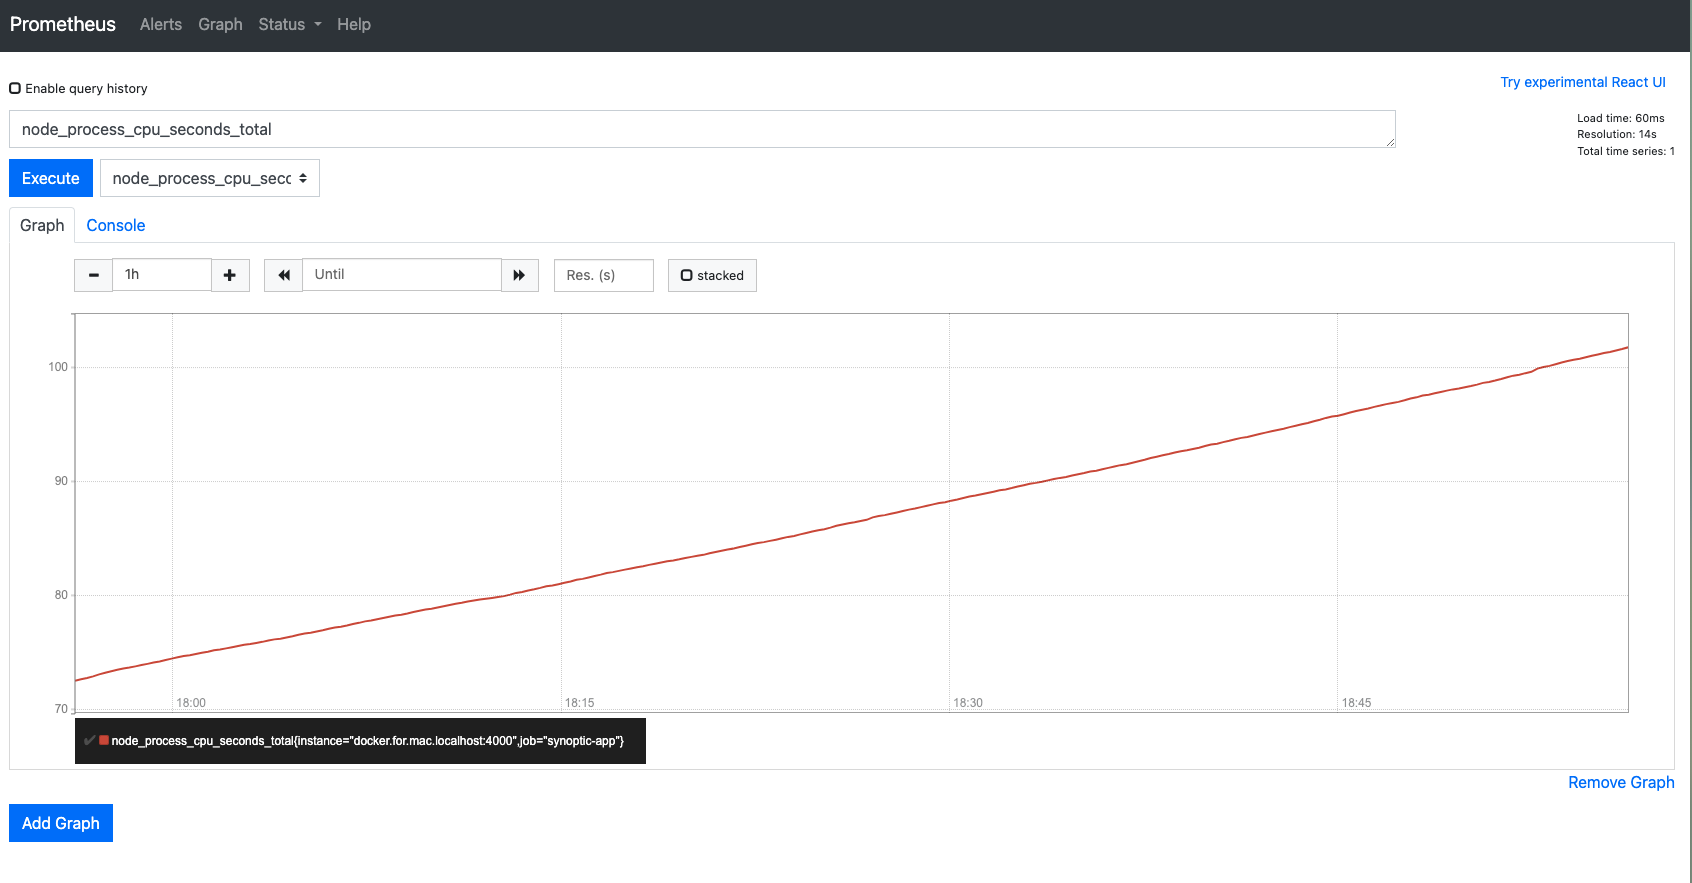
2. on localhost:9090
Prometheus 走 9090 port,有一個簡易 web UI, 讓我們用簡單的 table / graph, 看到這些數據隨時間變化的樣子。
3. on localhost:3000
Grafana 走 3000 port,透過 dashboard folder中定義的 dashboard.json,直接 config 出儀表板。
Test the monitoring results
基本指標如 cpu, memory, event loop只要 app在動都可以自動進行監測,不過像是 service routes 沒有打的話我們基本上不會從 Prometheus 與 Grafana上知道他們的 response time。因此,這邊便需要借助壓力測試工具 locust 來協助我們完成這個目標。
Locust 是一個以 Python 編寫的開源壓力測試工具,可以執行 app defined actions,比如發起 http request, 查詢資料庫並操作回傳資料等。目的是評估 web app 在高流量下的效能。
以下說明使用 Locust 的步驟:
1. build up virtual environment
|
|
2. install locust
|
|
3. write index.py and run it
|
|
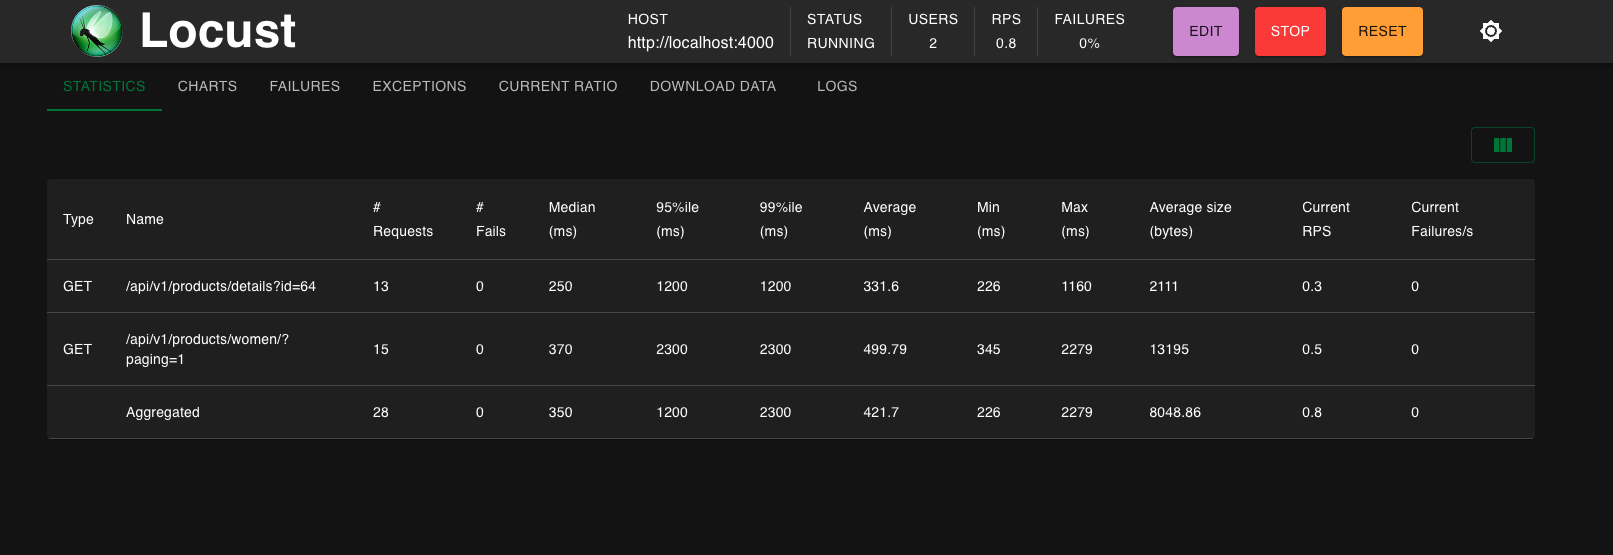
這邊假設有兩種 user action: BrowsingUser, 瀏覽主頁面的 /products/women/?paging=1。CheckoutUser, 在結帳之前會點擊某個商品頁面 /products/details?id=64。然後我們使用以下執行執行這兩個用戶行為模擬:
|
|
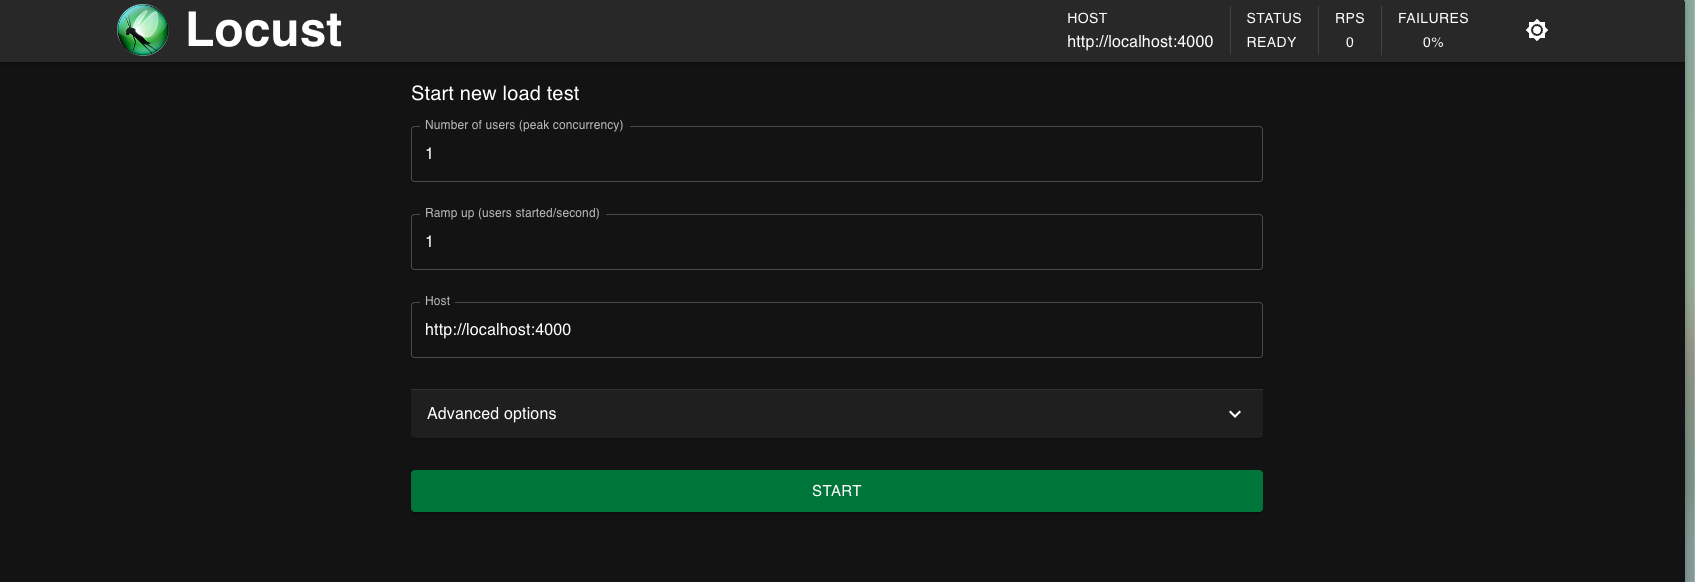
接著便可以在 http://0.0.0.0:8089/ 看到 Locust Dashboard了。可以指定使用者數量、每秒生成新用戶的速率(ramp up)。由於我們有兩個 user, 所以這邊設定使用者數量=2。
4. observations
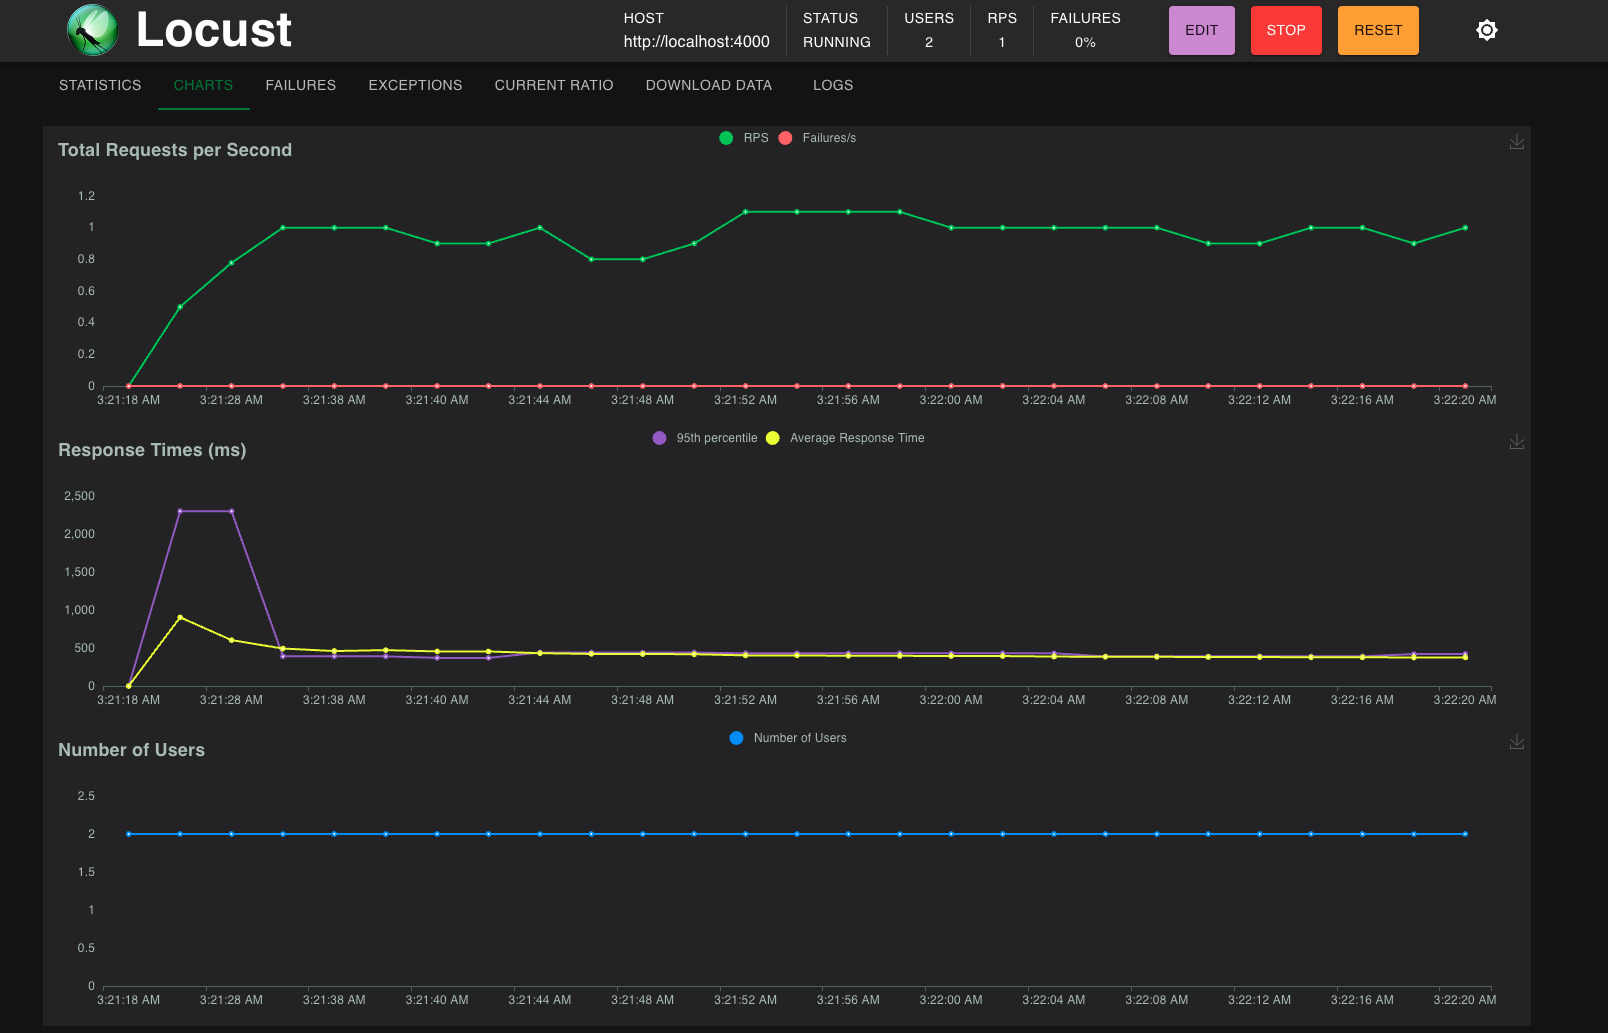
當同時啟動 server / prometheus / grafana container, 還可以把這些打 api的結果實時的傳送給 grafana dashboards。
Conclusion
透過這個簡單的練習,我們知道如何將一個 Node.js App 串接 Prometheus 與 Grafana,以及使用簡單的 locust load test觀察兩隻api的表現。日後可以思考的點是:要怎麼觀察出「異常」與「正常」之差異,並且根據異常狀態設計方法,真正達成系統效能優化的目標。